
Tips Sharing for XPS Series (2) Precise Navigation for Micro-area Analysis - SXI
In the last lecture of the PHI CHINA “Tips Sharing for XPS Series (1) Precise Navigation for Micro-area Analysis – SXI”, we learned together how to use the SXI function of XPS analysis to achieve precise navigation and precise analysis. With the discussion, we’ve made it clear that in the experimental analysis, the most important point is that the beam spotted size of the incident X-ray source needs to be selected, corresponding to the size of the sample. On August 5th, 2020 (Wednesday), PHI CHINA will continue to use "SXI" as the theme, extended the content of the first online lecture, and shared more SXI functions of XPS analysis experiments.
In XPS experiments or other analysis techniques, it is the most basic and important thing to know where the signal is really coming from. Therefore when doing experiments, how do analysis tools define the so-called "analysis area"?
For example, on the SEM/EDS instrument, analysis position is defined by observing the SEM image derived from the primary analysis electron beam source. Because the observation source and the analysis source are completely homologous and the same optical path, the definition of "analysis area" is completely accurate. For XPS, the most commonly used method is: when the sample is in the analysis room and shoot the sample using a CCD camera to define it as "analysis area". However, the actual situation is that CCD is not an analysis beam source, then what kind of problem does this have for the analysis results? (See below figure)
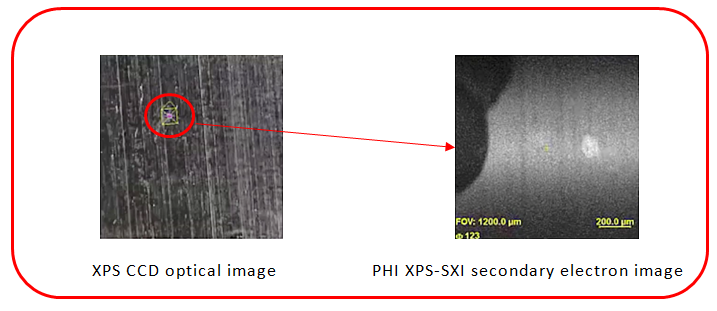
The real morphology of the sample in SXI on the right is not visible from the optical image.
This time, we take a variety of real samples as examples (such as powder, etc.) to actually operate and demonstrate how to perform XPS analysis. Therefore, everyone can understand more intuitive and profoundly :"Define analysis area and signal source area" is this most basic concept in the entire analysis process, even during data processing. Our ultimate goal is to obtain the most accurate and correct XPS analysis results.
 Mr. Wensly Yip 叶上远 – 高德英特 中国区 执行总监PHI (China) Limited Executive Director
PHI (China) Limited 高德英特(北京)科技有限公司
Narration in the online lecture by Mr. Wensly Tip
On 4th July 2020, we have brought the web class of the technical skill sharing of Accurate Navigation on XPS analysis by the function of SXI. With that, we have learnt and known that how important it is to have the capabilities to vary the primary analysis spot size so that fitting to the require analyzes / analyzed feature.
This time, we hope to bring you another online course that extends this concept. In real life, for XPS experiments and even many other analysis techniques, it is very important to know where to analyze and where the signal really comes from. Therefore, the most important point is simplicity: How analysis tools define/define the so-called "analysis area".
For example, on SEM/EDS instruments, the analysis position is defined based on the SEM image from the main electron beam. So, it is always completely accurate. For XPS, the common and most commonly used method is using a CCD camera to photograph the sample while the sample is in the analysis room. However, the reality is that the CCD is not the main beam.
In this extended course, we will take the real example of / as an example to demonstrate how to conduct a real experiment of XPS analysis. When considering the very basic concept of "defining the analysis area", after all, it returns to the theme of "precise navigation and precise analysis". Ultimately, this will help us obtain the most accurate and correct XPS analysis results.
To review Powerpoint of this topic, you may access Technical Info > Application Notes
You may watch back the video by accessing Technical Info > Technical video